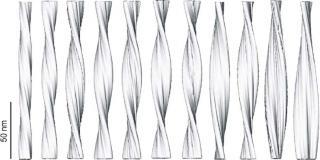
Reconstructions of Abeta(1-40) amyloid fibrils
All maps below are stored in Spider format and were reconstruction from single fibrils, recorded on a Philips CM12 at an underfocus between 2.1 and 2.3 μm. The reconstructions were low-pass filtered with a cosine-edged mask to a resolution of 20 Å. This value exceeds the resolution indicated by the FSC = 0.5 criterion (see below) and, therefore, the reconstructions include some of the noisier signal at higher resolution. Please see [1] for details.
Please download one file at a time or use the supplied scripts to download files sequentially. Attempts to download more than one file at a time will cause a Service Temporarily Unavailable message to be displayed.
| Image | Nominal mag | Beam voltage | Scan pixel size | Pixel decimation | Map pixel size | Resolution (FSC = 0.5) |
|---|---|---|---|---|---|---|
| Fibril1 | 60000 | 120 kV | 7.0 µm | 4 x 4 | 4.67 Å | 33 Å |
| Fibril2 | 60000 | 120 kV | 7.0 µm | 4 x 4 | 4.67 Å | 34 Å |
| Fibril3 | 60000 | 120 kV | 7.0 µm | 4 x 4 | 4.67 Å | 30 Å |
| Fibril4 | 60000 | 120 kV | 7.0 µm | 4 x 4 | 4.67 Å | 33 Å |
| Fibril5 | 60000 | 120 kV | 7.0 µm | 4 x 4 | 4.67 Å | 33 Å |
| Fibril6 | 60000 | 120 kV | 7.0 µm | 4 x 4 | 4.67 Å | 36 Å |
| Fibril7 | 60000 | 120 kV | 7.0 µm | 4 x 4 | 4.67 Å | 39 Å |
| Fibril8 | 60000 | 120 kV | 7.0 µm | 4 x 4 | 4.67 Å | 33 Å |
| Fibril9 | 60000 | 120 kV | 7.0 µm | 4 x 4 | 4.67 Å | 32 Å |
| Fibril10 | 60000 | 120 kV | 7.0 µm | 6 x 6 | 7.00 Å | 30 Å |
| Fibril11 | 60000 | 120 kV | 7.0 µm | 4 x 4 | 4.67 Å | 24 Å |
| Fibril12 | 60000 | 120 kV | 7.0 µm | 4 x 4 | 4.67 Å | 26 Å |


